DB Product Box — Teens Pilot Preview
PREVIEW — DB-driven product boxes for the teens pilot (teen-starter use-case weighting). Scores/specs/pros-cons/galleries/prices all pulled live from CamDB.
Photography fundamentals, advanced techniques, business guides, and course recommendations. From beginner basics to professional skills.
PREVIEW — DB-driven product boxes for the teens pilot (teen-starter use-case weighting). Scores/specs/pros-cons/galleries/prices all pulled live from CamDB.

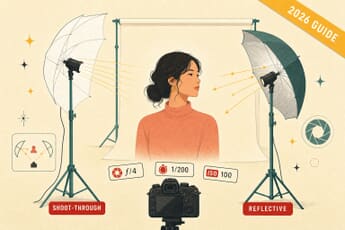
A practical 2026 guide to graduation photography: the exact settings for portraits and the cap toss, gear for every budget, how to handle harsh sun and dark ceremony halls, and the shot list to capture the whole day.

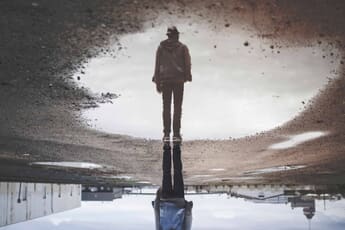
Norway’s Viking-themed 2026 World Cup squad photo by David Yarrow went viral — here’s what actually separates a great group shot from a forgettable lineup, and how to apply it to your own photos.
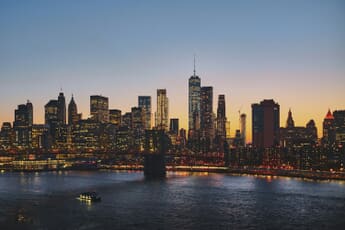
A complete one-day New York photo tour, sequenced around the light – DUMBO sunrise, Brooklyn Bridge golden hour, the Oculus and Grand Central, SoHo, and the skyline at sunset. Includes a free printable PDF with a Google Maps QR code for every stop.
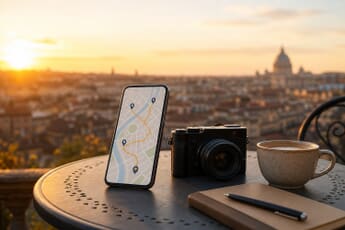
Use ChatGPT as a location scout and light-aware scheduler to plan a one-day photo tour – built around light, movement, and weather, not landmarks. Includes the photo-block framework, a rain plan, and copy-paste prompts that output a phone-friendly PDF with a QR code for every stop.
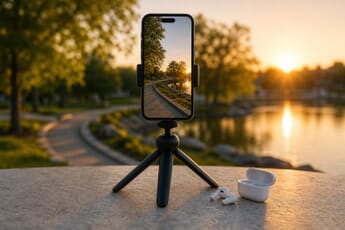
iOS 26 lets your AirPods trigger the iPhone camera with a press of the stem — no Apple Watch or extra remote needed. Here’s how to turn on Camera Remote and use it for self-portraits, group shots, and tripod video.

Looking to level up your photography skills? These are the 10 best photography YouTube channels in 2026, covering everything from Photoshop mastery to creative philosophy.
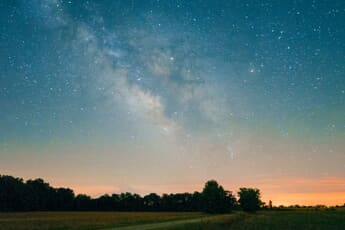
Your gear-first planner for June 2026 astrophotography: every night-sky event with the dates, lenses, and exact camera settings — Milky Way season, the Venus-Jupiter conjunction, and the Strawberry Moon.

What are the best settings for macro photography? Discover six key settings for jaw-dropping close-up shots!
Hasselblad just disqualified an AI image from the Masters 2026 shortlist — but only after Reddit and Instagram users flagged it. The detection landscape competitions actually need: C2PA Content Credentials at capture, forensic image analysis as a second pass, and an end to relying on human judgment alone. Honest answer: experienced photographers can’t reliably catch top-tier 2026 AI anymore. Here’s what’s broken and what to do about it.
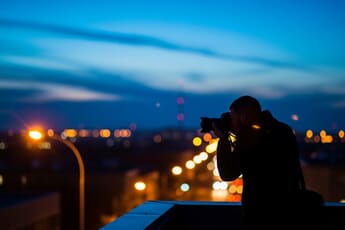
Master low light photography with proven techniques for eliminating camera shake and motion blur. Covers exposure settings, IBIS, AI noise reduction, fast lenses, creative techniques like light trails and astrophotography, plus smartphone Night Mode tips.
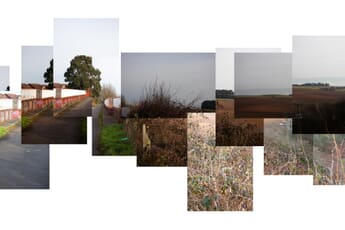
A step-by-step guide to Hockney-style joiner photos. Create artistic masterpieces with a few images and some Photoshop tricks!
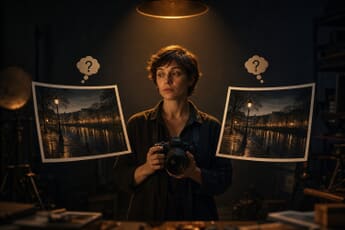
10 paired photos. One in each pair is real, one was generated by gpt-image-2 from a scene description. No camera reveals, no captions, no EXIF clues — just your eye. The average reader scores around 7/10. How many can you catch?

Do you need some macro photography ideas? Discover 20 amazing macro ideas that you can shoot today! You’re guaranteed to be inspired.

Digitizing paintings is best done with a camera and a lens, so here is our nifty guide on how to photograph paintings for prints!

What’s the secret behind those jaw-dropping car photos? We share the best car photography tips to help you capture compelling images.

Learn how to set up loop lighting for portraits. Covers key light position, modifiers, fill light, natural light techniques, common mistakes, and how loop compares to Rembrandt and butterfly lighting.

Hands-on review of iPhone Editing Academy by Clifford Pickett: 80 videos across four core modules and four bonuses, covering the native Photos app through Lightroom Mobile, local masks, and complete editing workflows. Verdict, pricing, and who it’s actually for.
Here is our ultimate guide on how to set up umbrella lighting for photography. Get all of the knowledge you need to take stunning photographs!

Master 20 easy photoshoot poses for women with our comprehensive guide. From classic confidence-boosting positions to creative seated poses—perfect for portrait photographers and anyone stepping in front of the camera.

Learn what photography aesthetic means and how to develop your own distinctive visual style. Covers composition, lighting, color, and editing approaches for creating cohesive, recognizable work.
Forced perspective photography turns size and distance into illusion. Learn the geometry, camera settings, smartphone telephoto tricks, six viral 2026 setups, gear, and the four mistakes that ruin the shot.
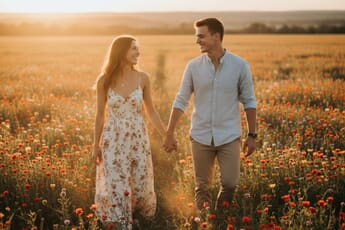
The ultimate guide to photoshoot ideas for every occasion. 100+ creative concepts for couples, friends, kids, birthdays, and seasonal sessions.
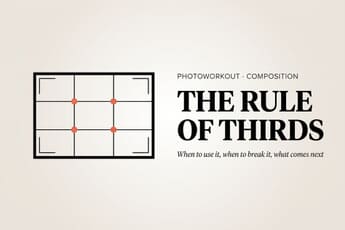
What is the rule of thirds in photography? Discover everything you need to know about this helpful composition guideline!
Check out the best indoor photoshoot ideas for a rainy day. Create stunning shots with basic household items!

Do you want to capture stunning flower macro photography? Discover the secrets to incredible flower photos. Level up your photography!
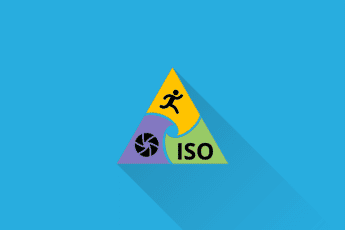
Learn how aperture, shutter speed and ISO work and when you to shoot photographs in aperture or shutter speed priority mode.

What is Manual mode, and how do you use it to improve your photos? Discover everything you need to know–for amazing images!
What is the zone system, and how can you use it to get consistently perfect exposures? Learn all about this technique pioneered by the photography greats!
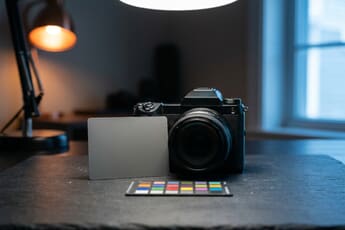
White balance refers to the process of correcting color casts in your photos. You can set the white balance yourself using a gray card.
When’s the best time to take pictures outside for stunning results? Discover our favorite types of natural light for amazing photos!

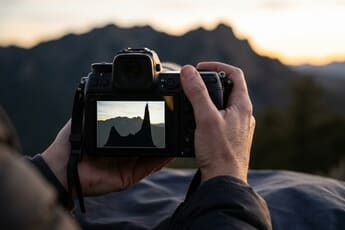
Learn how camera metering modes work, when to use evaluative, center-weighted, and spot metering, how AI metering works in modern mirrorless cameras, and when to use exposure compensation.

From commercial photography to emerging AI-adjacent roles, here’s our comprehensive guide to the highest paying photography jobs — with current salary data from BLS, Glassdoor, and PayScale, plus freelance vs. salaried income benchmarks.